Analyzing My Meal Plan
Since this post was written, Stanford changed the software they use for tracking our meal plans. Most of the visuals are out of date, and calculations may be innacurate.
Like most other colleges, Stanford offers a dining plan. While this article started out as a basic concept (compare Stanford’s dining plans) it quickly turned into something much larger.
The Meal Plans
Let’s start with the original point of this article: analyzing the different meal plans at Stanford (we’ll get to the graphic above in a second). Dining halls at Stanford operate on a “swipe” based system of attendance. Once you’ve swiped in for one “meal,” you can eat however much you want for that meal, until the dining hall closes. Dining halls have different hours, but most are open for 19 meals per week: breakfast, lunch, and dinner on weekdays, brunch and dinner on weekends.
Stanford offers 2 options to underclassman undergraduates:
| Swipes / Week | Cardinal Dollars | Guest Swipes | Meals / Week |
|---|---|---|---|
| 19 | $0 | 5 | 19 |
| 15 | $110 | 5 | 16.45 |
All freshman start on the 15-meal per week plan, which also gives $110 in “Cardinal Dollars” which can be spent at specific on-campus locations (for example, late-night dining, the football stadium, etc.). Because of this need for late-night dining (the latest dining hall closes at 8pm) most students stay on this plan, rather than switching to the 19-meal per week plan.
15 Meals / Week Plan
The 19-meal per week plan means that students basically have unfettered access to the campus dining halls. This is nice in theory, but most students end up skipping a few meals, which makes this meal plan seem “not worth it.”
19 Meals / Week Plan
A popular discussion among students is comparing the dining halls to various local restaurants, including Chipotle, In-N-Out, and buying entire meals from Trader Joe’s.
Cost Comparison
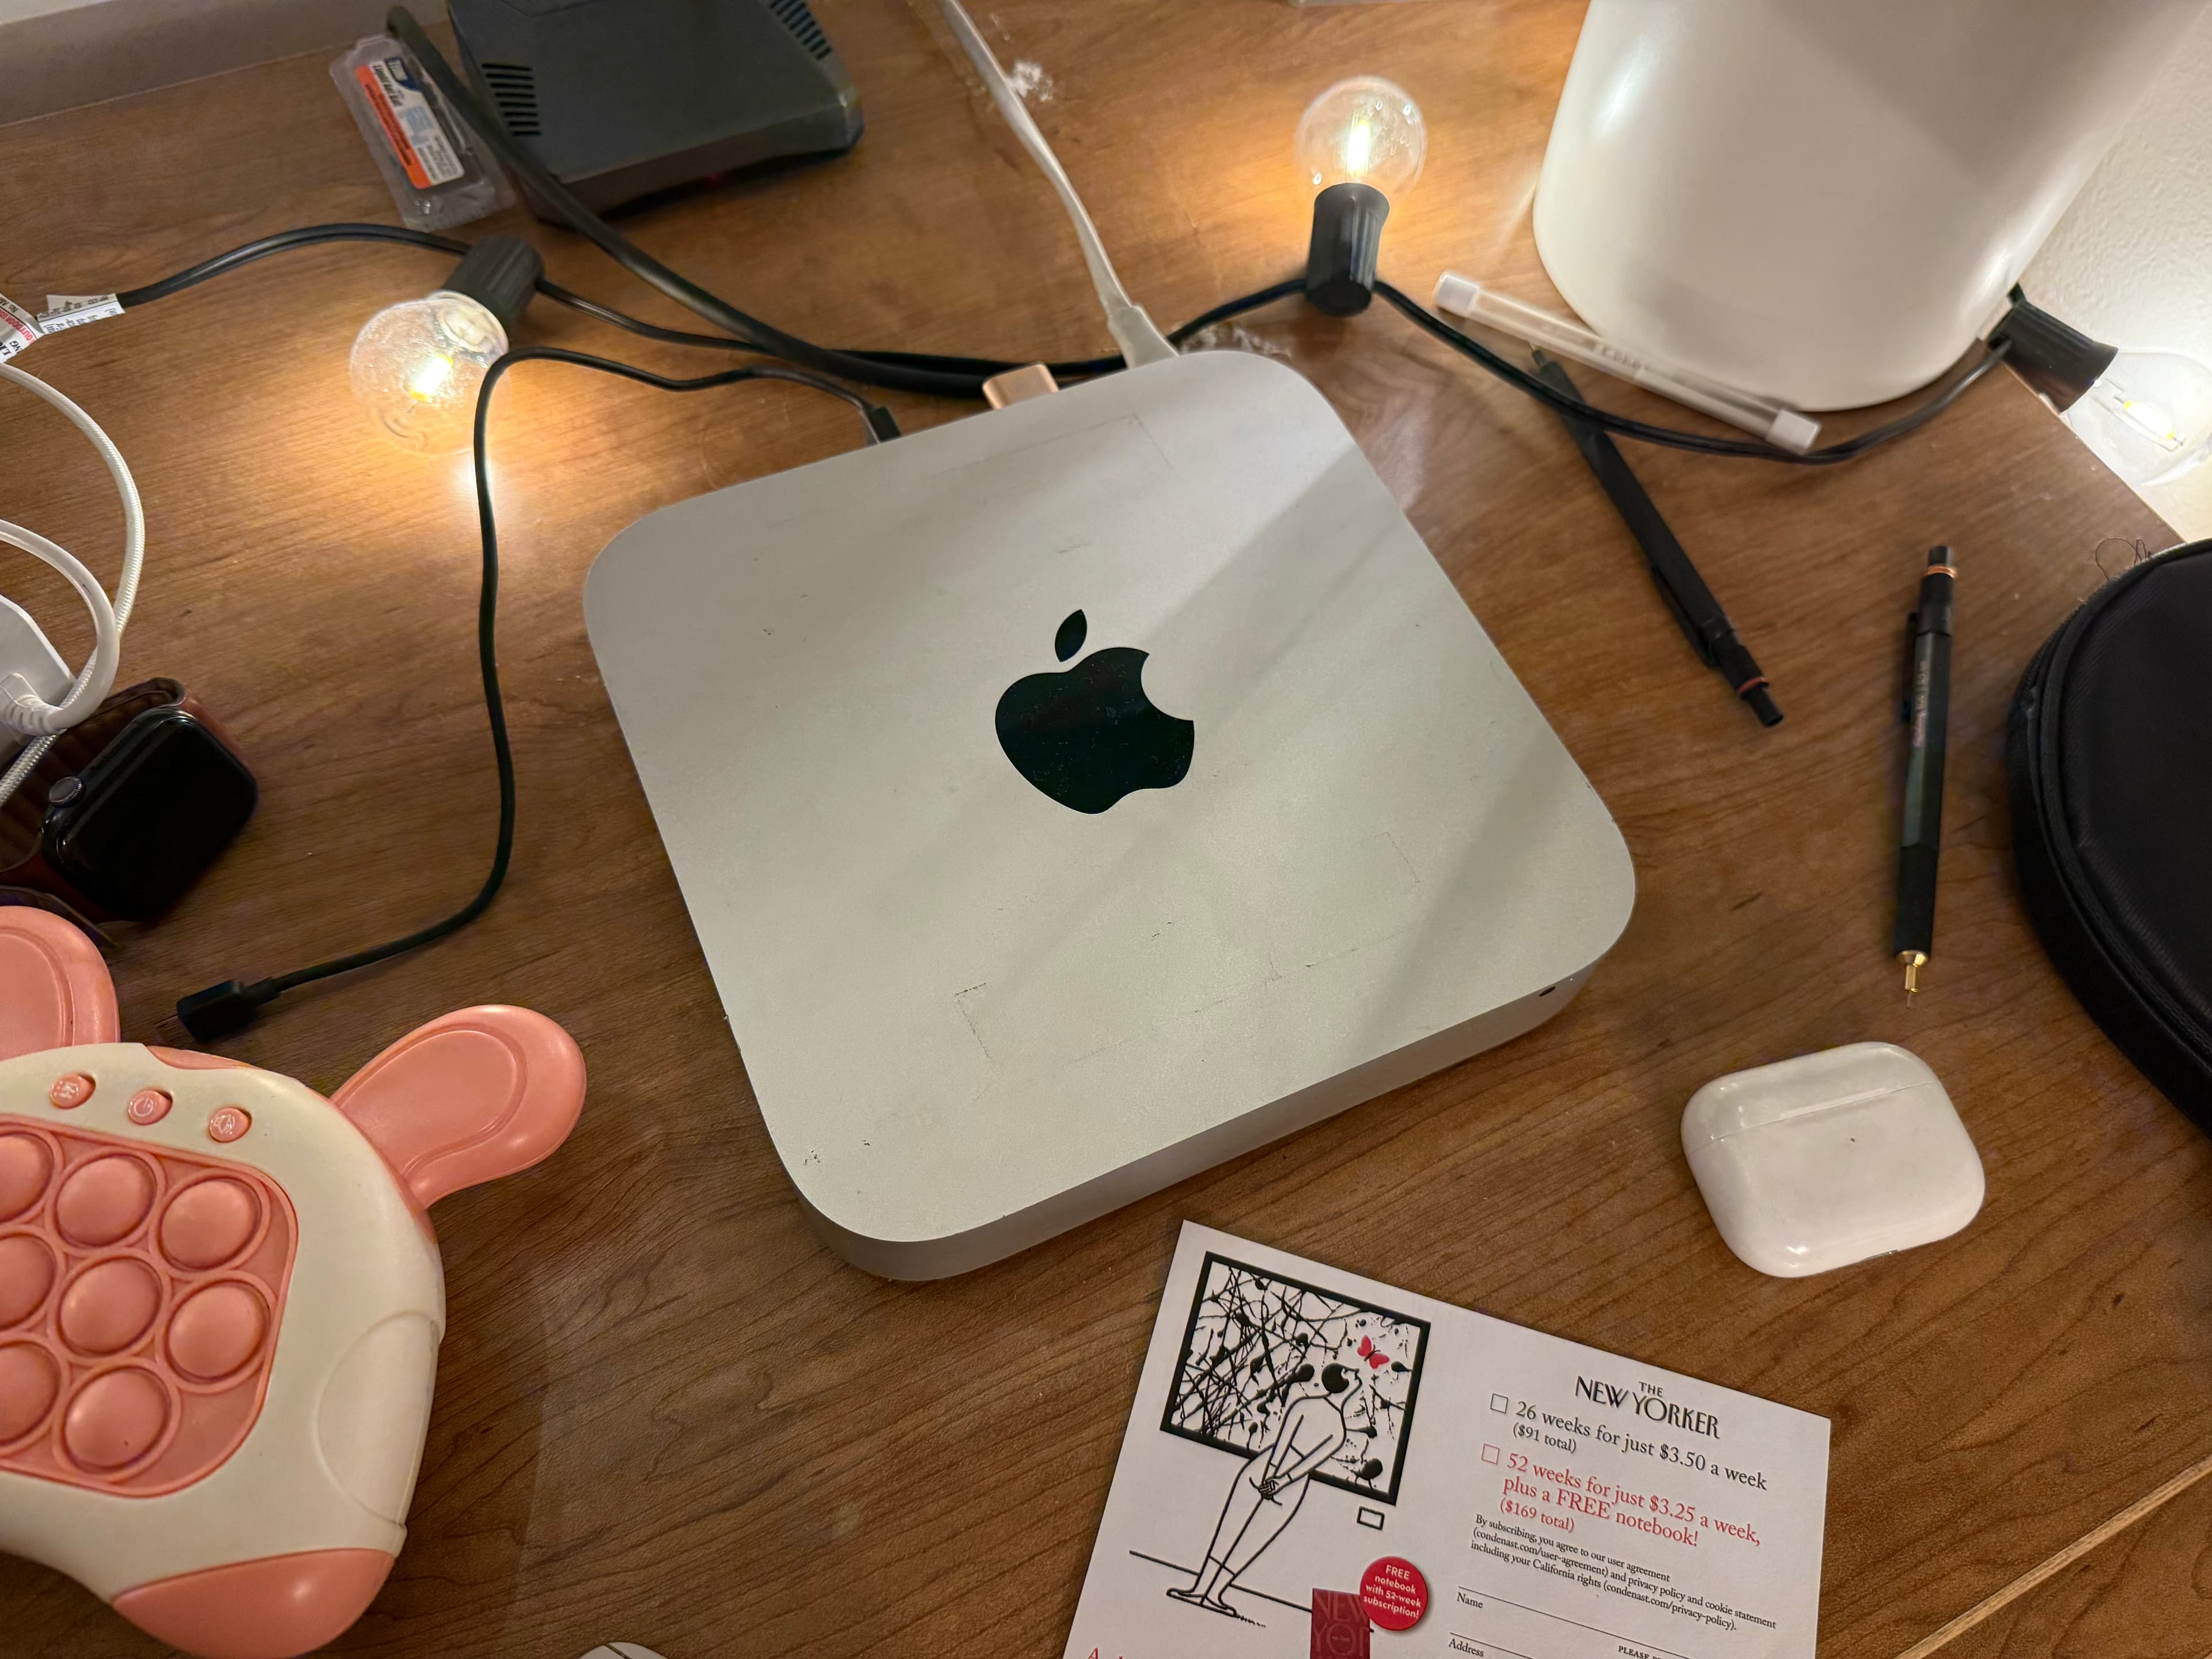
One Mac Mini
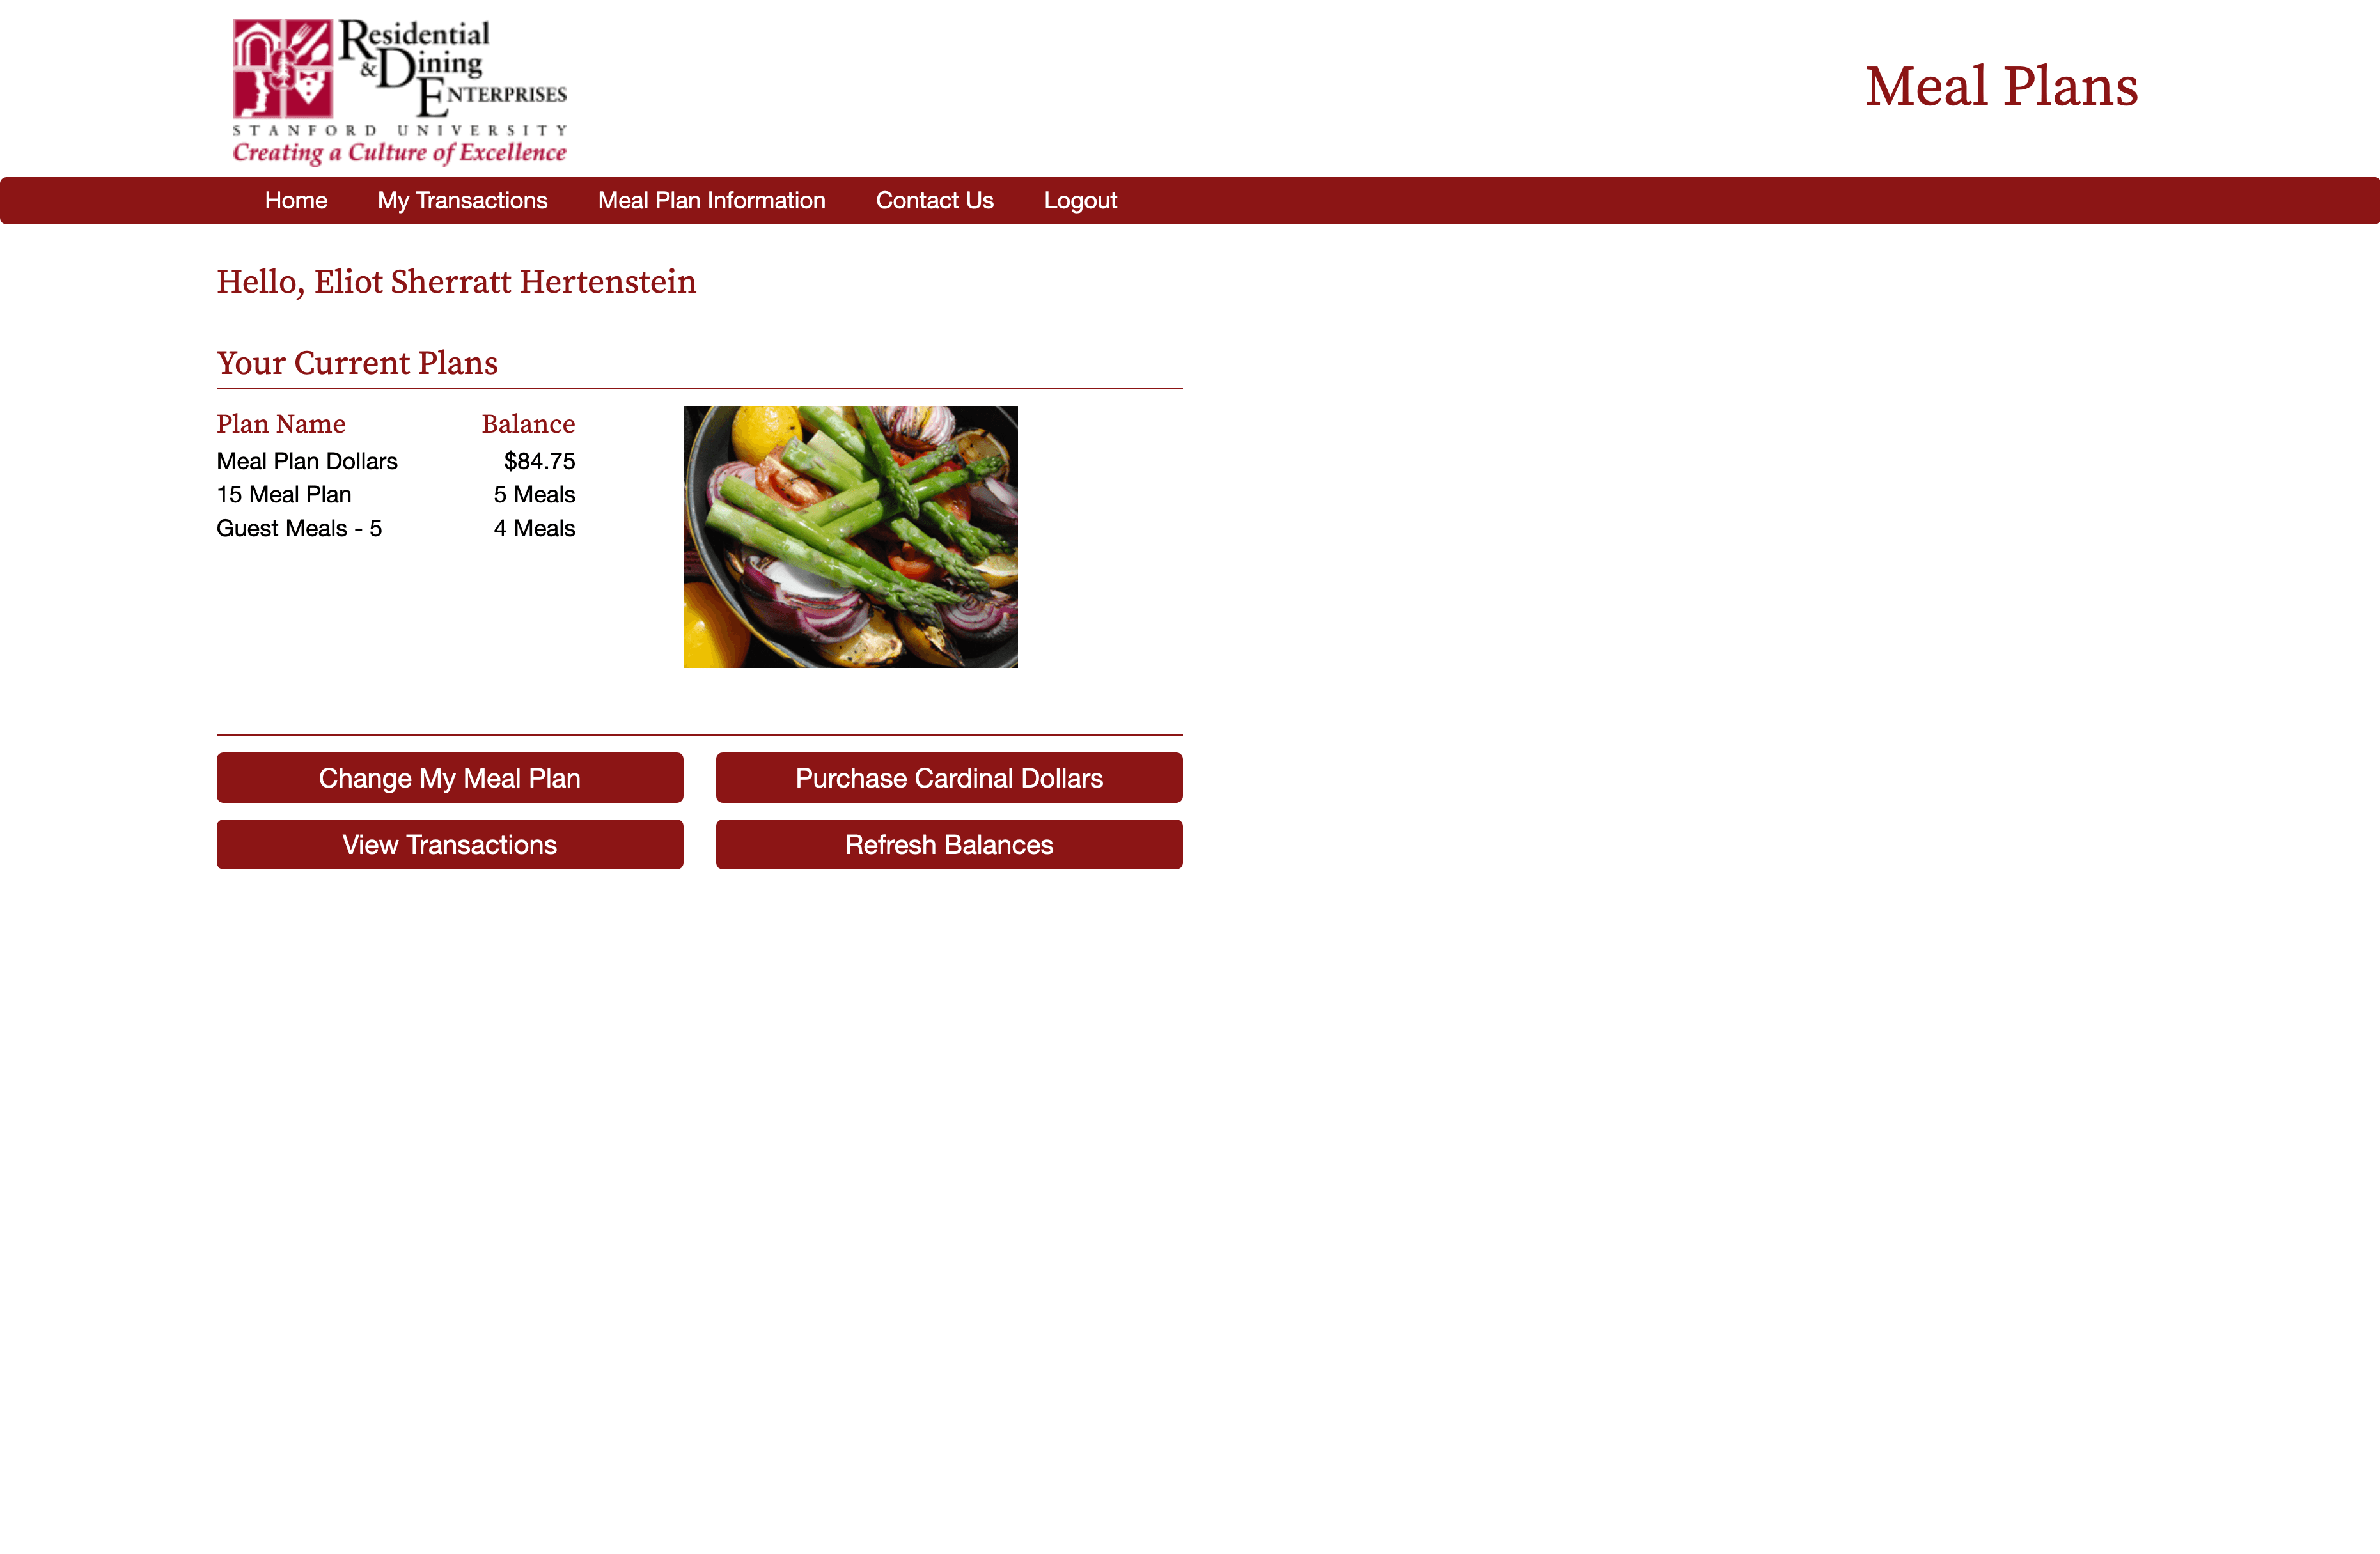
The top of this article includes a running count of the swipes I’ve used this week compared to how many meals are left in the week. While this seems simple, getting the data is actually fairly complex. The solution I came up with probably isn’t the best idea, but it basically works!

Stanford provides a web portal to access current meal plan information. However, it’s locked behind a login page, so I can’t access it easily with an API request. The entire site is also SSR, which means there’s not even a JSON endpoint if I wanted one.
Luckily, Stanford also offers a service called “Cardinal Key” which allows users to bypass the Stanford login by trusting a root certificate. By combining this with some sort of browser automation (for reasons I’ll get into in a minute) I figured I could bypass the login page and access my own dining plan information programatically.
The next step here was to buy a Mac Mini.

Stanford only offers Cardinal Key for Windows and Mac machines (along with mobile devices) so that eliminated most options that involve some sort of VPS. Windows seems awful for any sort of hosting task, so I decided to just buy a Mac Mini on Facebook Marketplace – I did briefly consider some sort of Mac VPS, but the cost to rent one would’ve exceeded the cost of a used mini in less than 6 weeks.
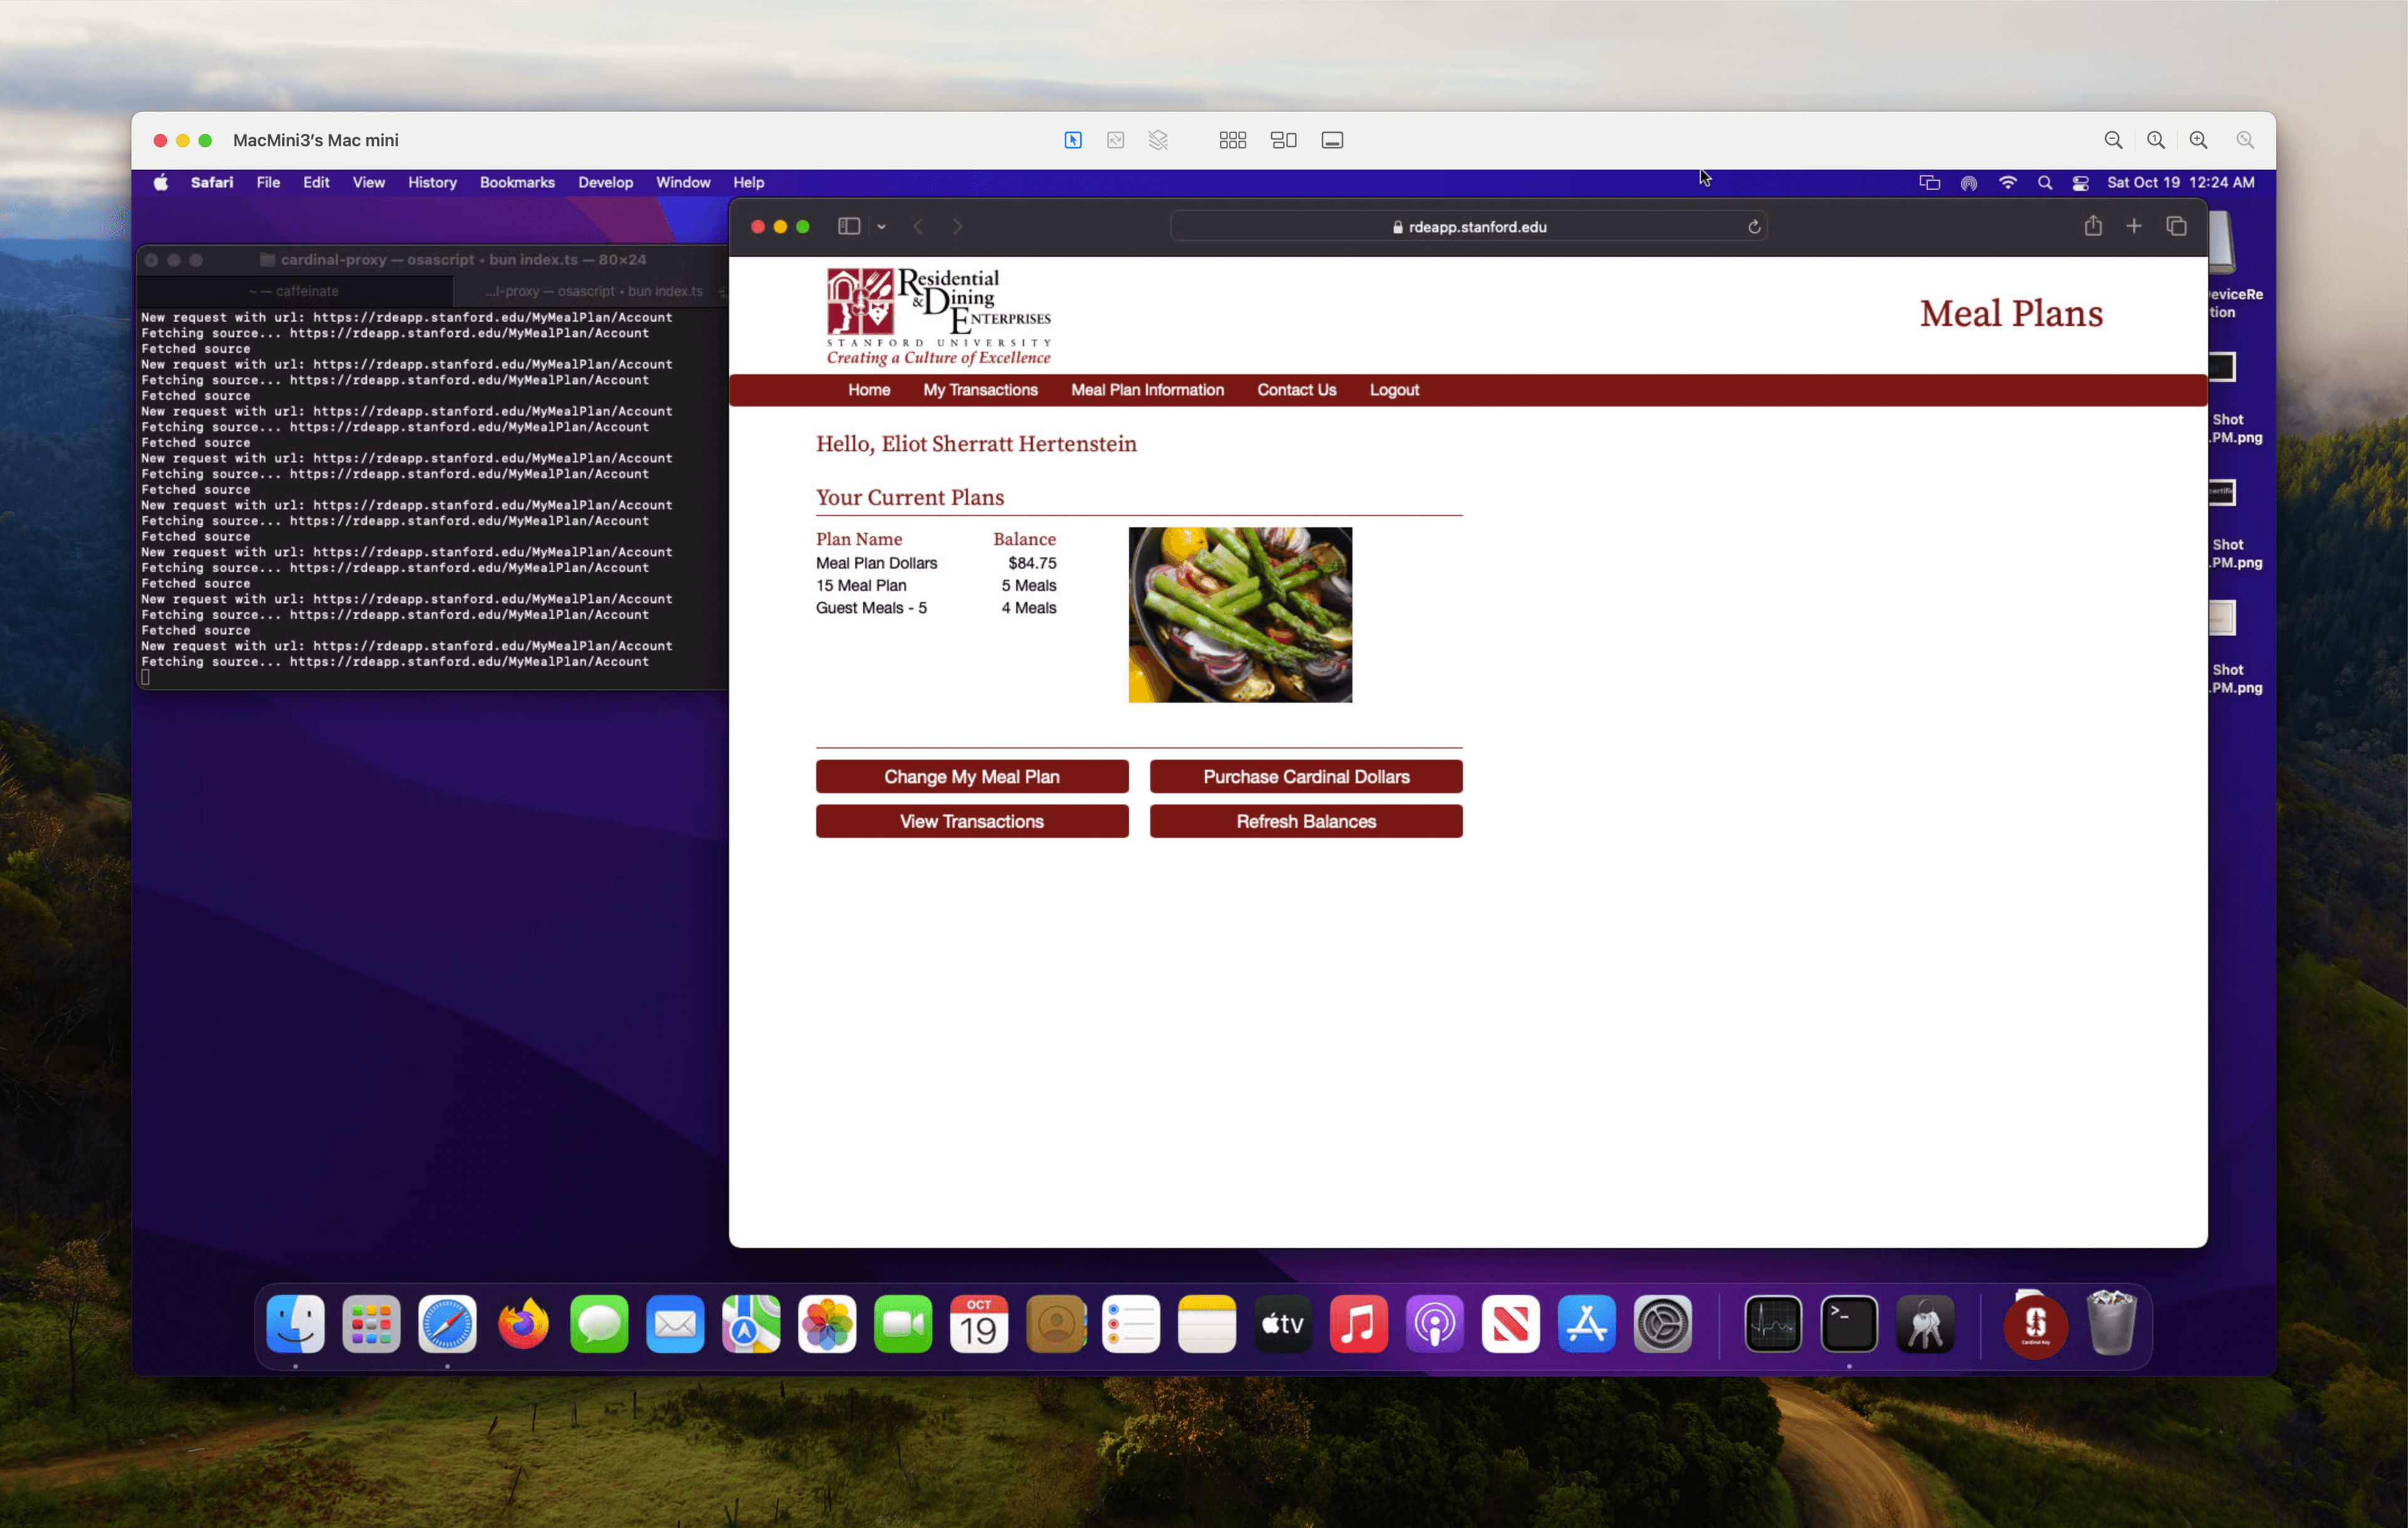
With the Mac Mini acquired (and screen sharing setup via Tailscale) my next step was to figure out how to automate interaction with the browser. Stanford’s cardinal key requires some sort of javascript (as far as I can tell) so that eliminated most non-browser options. After messing around with Playwright for a while, I decided the easiest course of action was literally running AppleScript on my Mac via the command line. Safari plays really nice with root certificates, and I can do most of the interaction with the actual website (if needed) via JavaScript.

Because this operation is fairly expensive, I decided to move the actual data-management aspect of this project onto my Hetzner VPS. I run an extremely simple web server on my Mac Mini that accepts requests via Tailscale from my VPS. When the Mac receives a request, it runs the AppleScript and returns the site HTML. Then the script on the VPS parses that data into JSON, and updates a JSON file. There’s a separate web server running on the VPS which acts as a proxy, serving the JSON file to incoming requests.

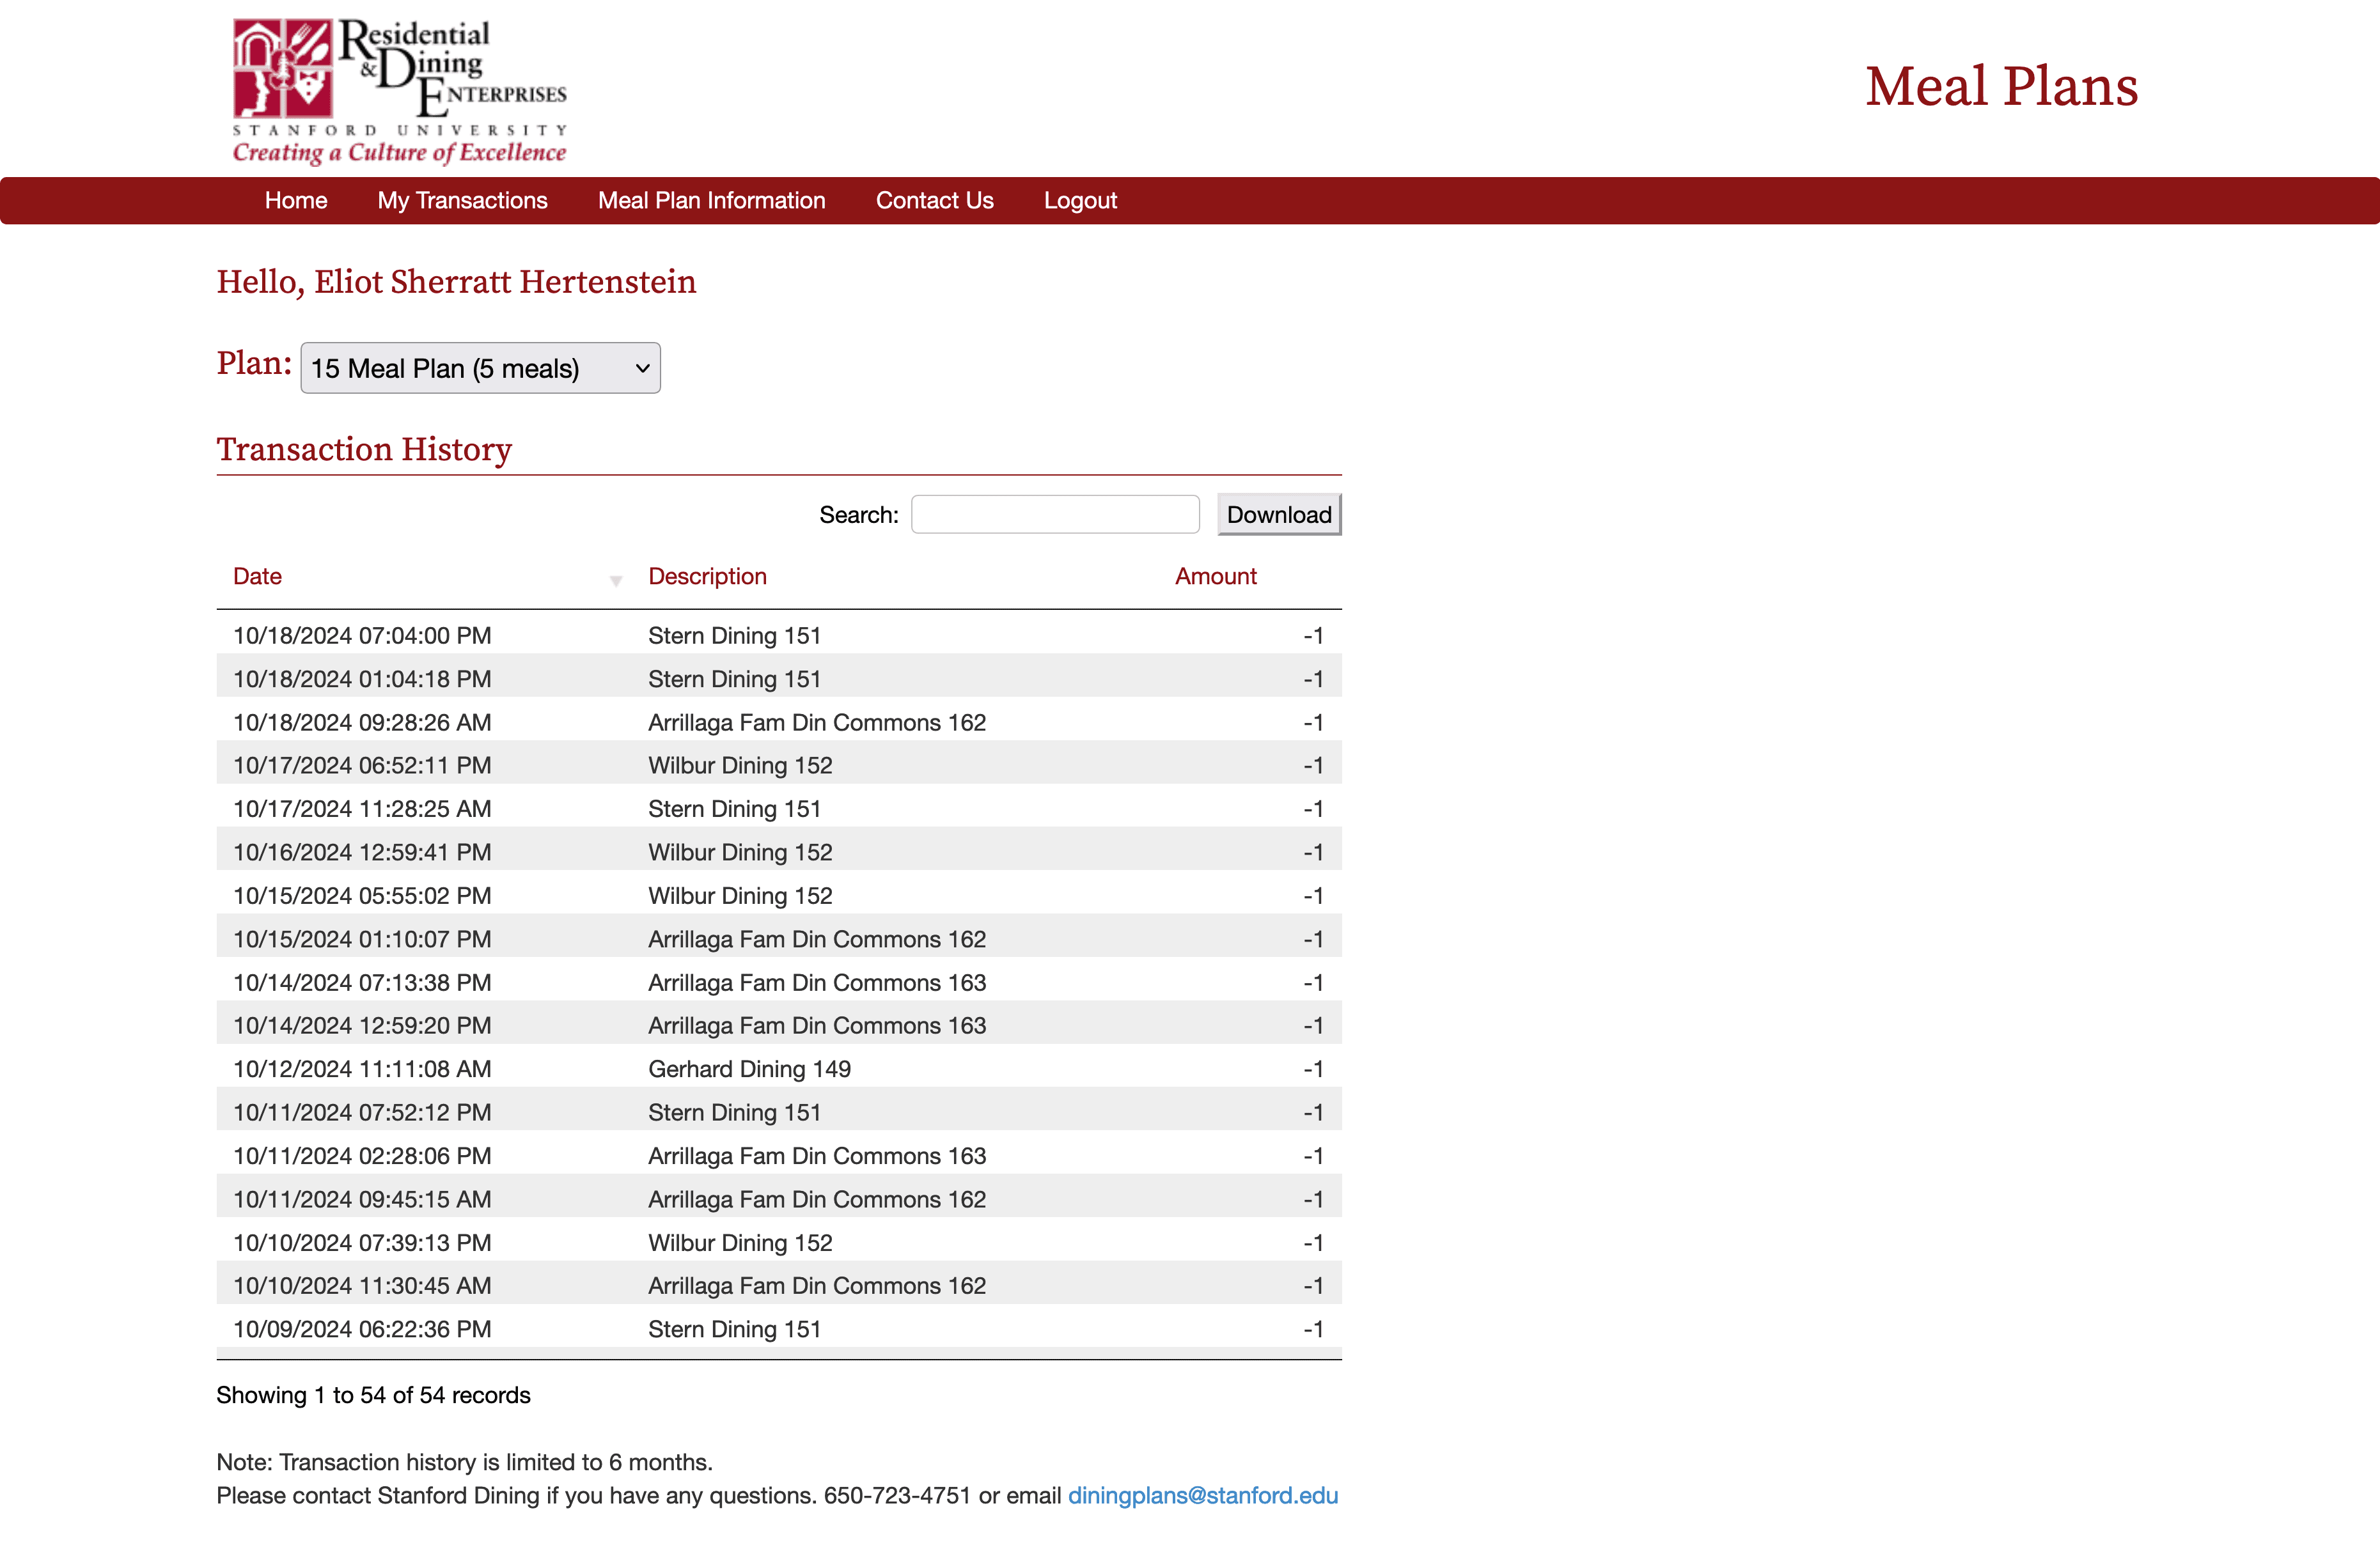
Getting my transaction history is a bit more complicated. On the dining website, the user needs to submit a form by selecting a plan from a dropdown. Once that happens, the site loads the transaction history as HTML. I’m planning on implementing this automatically at some point, but right now I don’t have enough transactions to determine how Stanford implements the pagination for the table. So, I just wrote a quick userscript that allows me to download the data as JSON. This page parses that JSON into infographics, like the one below:
Dining Hall Frequency
Honestly, this entire process is overcomplicated, but as far as I can tell, it works! I expect it to break every 90 days when the Duo (our 2fa solution) cookie expires, but that’s good enough for me.
Takeaways
My main takeaway here is just “wow, it’s so cool to have this data.” A few days ago, Stanford sent a survey to all students, of which the first question was “list your six closest friends.” Even though that sort of data isn’t accessible to me, I find the idea of assembling a social graph so fascinating, just because of the sort of things you could do with it. The same applies here – I’m very interested in creating new graphics and presenting this dining hall data in interesting ways going forward. When do I tend to eat breakfast, lunch, or dinner? What meal do I skip the most? What dining halls do I visit on which days? Making those graphics, even if it has no larger impact on my life, has some inherent value to me. They’re art – I don’t have to justify it.